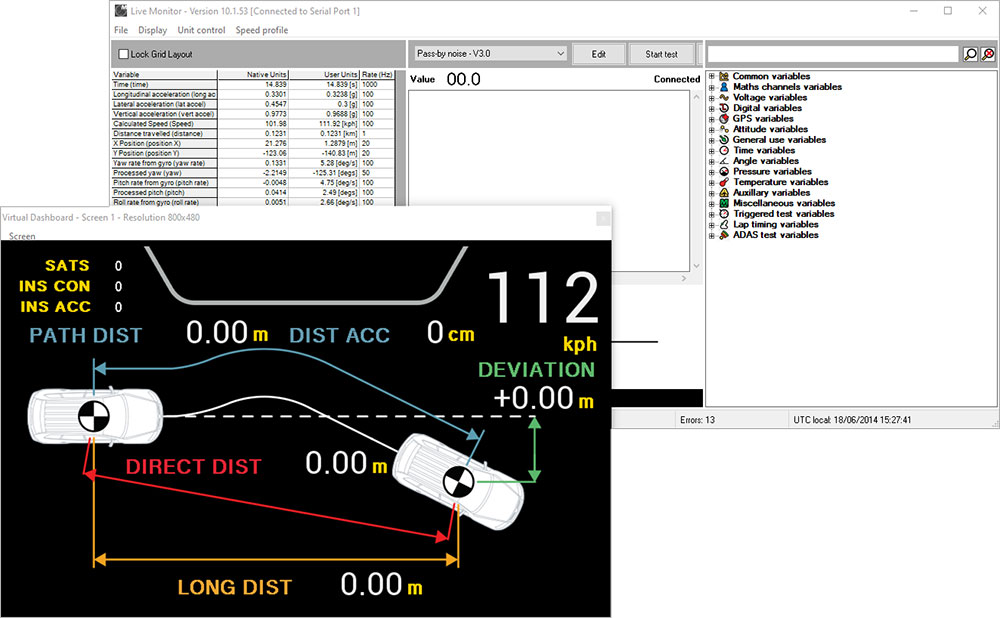
Live Monitor software

The all new Live Monitor software is a user friendly, real-time monitoring software that will display all data output from our all current data logging products. The 3 main sections; the first displaying as text and numbers all channels, the second can visualise variables using customisable controls, and the third a variable manager.
The Live Monitor software is ideal for checking the function of sensors as well as other data channels. Simply connect to the data system and all of the channels being output will be displayed in the first section; with values, units and rates.
For clearer viewing of specific values controls can be set up to graphically display variables. The software consists of several types of controls such as metres, LED displays, indicators and graphs that can be used to visualise different types of data coming from the hardware. Each control can be customised by the user to get the exact look they require.
The user interface has a great deal in common with the analysis software, for example the variable manager functionality is very similar and you can even share the same variable definition files between the 2 programs, so once you have all you sensor definitions in the analysis program, then you can simply export them to the monitor program.
 Basket (0)