Dynamic Line Control
On this page:
- Introduction
- Using the dynamic line control
- Properties
Introduction
Dynamic line control consists of two points and a line that connects those points.
The line is drawn dynamically between the points as the location of the points change. The location of a point is decided by two variables assigned to the coordinates of the point.
Note that these two points are referred as Start position (of the line) and End position (of the line) in the control’s properties page.
You can assign up to 5 variables to the dynamic line control:
- 4 variables to the coordinates of the two points (start and end positions).
- 1 variable to the line colour property. When assigned, line colour changes based on the value of the variable.
Using the dynamic line control
The design screen has two scales, called x-axis and y-axis. The zero point (origin) of both x and y axes are in the top left corner of the design window. As you go to the right on the x scale, the values get larger and are positive. As you go down from zero on the y scale the values get larger and are positive. The maximum x and y values depend on the video mode (PAL, NTSC…) that can be selected using the view menu.
To get coordinates of a point, move the mouse over the design area and look at the bottom left corner of the status bar of the VIDEO4 control.
X and Y coordinates of a point (start or end position) of the dynamic line control is calculated by using the following formulas:
X = Base location of X + (Variable1 x Multiplier)
Y = Base location of Y + (Variable2 x Multiplier)
Each point (start position and end position of the line) in this control has a base location. Base location is the position of a point at the start of data logging. Location of a point changes around the base location as their X and Y coordinates change.
The x and y coordinates of the end points of a dynamic line (start and end positions) can take any value between zero and maximum x and y values of the design area.
Note: During the run time the line can grow outside of its control box area. This behaviour is different to other controls, because other controls’ activity is limited only to their control box. So it is necessary to calculate the maximum and minimum values for X and Y coordinates for a point to ensure two things:
- To avoid the line from growing outside of the area that you want it to be
- To avoid the line from going out of the screen area if the coordinates of a point exceeds the maximum x and y values or goes below zero
Remember that base location should always greater than or equal to zero or less than or equals to the maximum screen x and screen y.
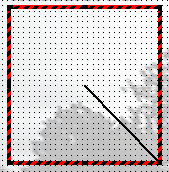
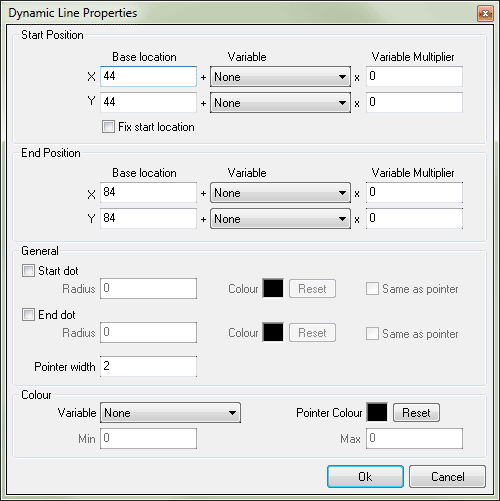
Following is a simple example that shows a dynamic line control that is used to show the latitude and longitude acceleration using its end position. Its Start position is fixed. A bitmap control is placed under the dynamic line control and its Z-order property is set to Bottom. The property page for the dynamic line is shown below after the example.
Properties
Start and End position properties for X and Y coordinates:
Base location: Base location is the value of x (or y) coordinate of start (or end) position of the line at the start of data logging.
Variable: Variable assigned to the x (or y) coordinate of the start (or end) position
Multiplier: variable value is multiplied by this value. This can be used to Increase or limit the length of the line.
Fix start location: Fix the start location to its base location.
General Properties:
Start dot: displays a circular dot at the start position of the line.
Radius: radius of the start dot in pixels.
End dot: displays a circular dot at the end position of the line.
Radius: radius of the end dot in pixels.
Colour: colour of the start (or end) dot.
Same as pointer: uses the line colour as the dot colour and ignores the colour setting described above.
Pointer width: width of the pointer (width of the line drawn between two points).
Colour properties:
Variable: This will be used to change the colour of the line based on its value. You must also set the Min and Max properties to enable this. Select None to disable this function.
Min and Max: Colour change occurs based on the values in the range defined by Min and Max values.
Pointer colour: Allows you to set a static line colour. To enable this property, set the variable property described above to None.
In the following example variable is set to speed and it shows the line colour change in three different speeds.