Lap And Sector Times
To access the Lap And Sector Times table, go to > Results > Lap/Sector Times or click the  button. The "Lap and sector times" table is the most convenient way of checking either lap times or sector times for all the runs currently loaded. Once you've added a lap marker to the track map, the lap times will automatically appear in the table - once you've defined sectors for the track then you will also get sector times for each lap.
Mini bar-charts are shown along with the lap/sector times, so you can quickly identify fast and slow lap/sector times.
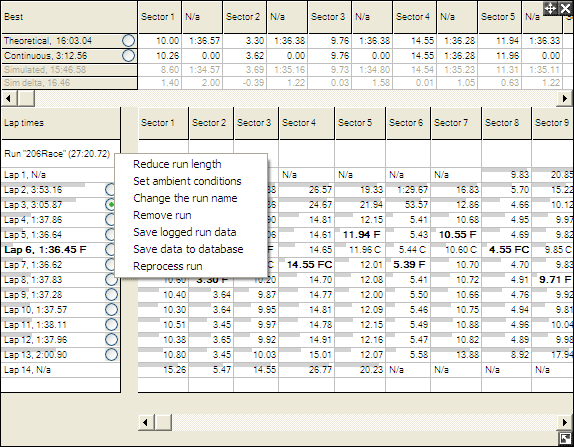
The Lap And Sector Times will list the times for all the runs loaded into the software, and will be displayed minutes : seconds : hundredths of a second where the time is greater than or equal to 60 seconds, and seconds : hundredths of a second where the time is less than 60 seconds. The current fastest lap and sector will be highlighted in bold and be followed by a small chequered flag.
Fastest theoretical lap which is made up by adding together all the fastest sectors are marked with a “F” and the fastest continuous lap with a “C”.
There are 4 special rows at the top, these are:
- Theoretical – this is the fastest sectors off all data currently loaded and added together to give you a lap time that you would have got.
- Continuous – this is the fastest actual lap of the data, but not necessarily starting and finishing at the track marker
- Simulated – this is the time that the analysis software predicts was possible for this circuit, note that for this time to be meaningful the simulation options need to be configured correctly, there is more information on this here
- Sim delta – this is simply the difference between the simulated time and the best time achieved in the data that is loaded
You can specify options that effect a specific run by right clicking on that run.
You can highlight data in the Lap And Sector Times table for analysis in XY graph, the bar chart, the values tables, the summary statistics, the performance calculations table and the virtual dashboard. selected areas will also be highlighted on the track map. Please note that you can only select data ranges from one column at a time. While you cannot compare sector 1 with sector 2, you can compare Run 1 with Run 2. This is useful for comparing different drivers or car settings etc.
The example below has the fastest time for the first sector of each run highlighted:
These can now be compared in a variety of different ways, the main focus being into the graphs and statistics tables. When you highlight in the Lap and Sector Times table, the Summary Statistics window will detect that, and display the calculations it's been set to "Display for selected areas". To generate graphs for the data selected, go to > Results > Quick XY Graph or click the  button. This will open up the Quick XY Graph, click here for more information on Quick XY Graphs.
You can also look at the data using interactive mode in several other results windows. Click here for more information on interactive mode.
For more information about automatically adding lap markers and sectors, Click here.