Heading Accuracy
Accurate assessment of SPEEDBOX heading accuracy is quite difficult to measure as there is nothing more accurate to compare against. The test procedure here was simply to fit the SPEEDBOX system to a road car and drive along the same path 10 times. The road was open with no large building directly adjacent, but tree lined – so GPS reception was very good, but not as good as it would be at an open test track. Before the test was carried out the driver practiced taking the course at a relatively constant speed of 70kph, and for each pass following the same line. The serial output of the SPEEDBOX was logged using a VIDEO4 so at the end of the test we had both video as well as SPEEDBOX data so we could visually check that the vehicle was driven correctly.
The summary of results are shown in the graph below:
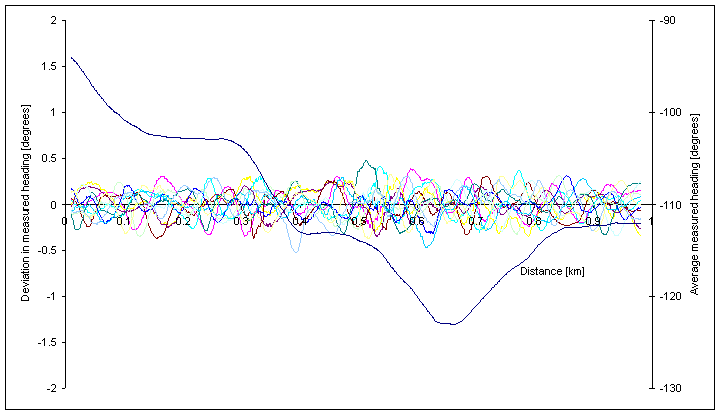
In fact the results are quite disappointing, in that the variation from run to run gives a standard deviation of about 0.2 degrees. The problem is that it seems almost impossible to drive the car in a more repeatable path than this. To demonstrate that these errors are effectively random, as you would get from slight variations in path or other non systematic errors, the estimate of error was carried out in an alternative way and is shown in the table below.
| Test Number
| Time to complete section [s]
| Average speed [kph]
| Total distance [m]
| x distance [m]
| y distance [m]
| Heading [degrees]
|
| 1
| 50.53
| 69.66
| 982.09
| -911.40
| -341.93
| 69.44
|
| 2
| 50.51
| 69.76
| 982.43
| -911.72
| -342.11
| 69.43
|
| 3
| 50.51
| 69.71
| 982.26
| -911.72
| -341.56
| 69.46
|
| 4
| 51.65
| 69.75
| 982.46
| -911.72
| -341.56
| 69.46
|
| 5
| 50.51
| 69.76
| 982.65
| -911.72
| -341.56
| 69.46
|
| 6
| 50.50
| 69.80
| 982.51
| -911.97
| -341.76
| 69.46
|
| 7
| 50.48
| 69.83
| 982.02
| -911.33
| -341.83
| 69.44
|
| 8
| 50.49
| 69.77
| 982.35
| -911.62
| -342.06
| 69.43
|
| 9
| 50.48
| 69.75
| 982.14
| -911.53
| -341.75
| 69.45
|
| 10
| 50.47
| 69.81
| 982.16
| -911.46
| -341.93
| 69.44
|
standard deviation of heading = 0.0131304
For each test we assumed that the vehicle started and finished in the same location. For each test we calculated the change in position using only the speed and heading information by integrating the following:
X position = integral of ( measured speed * sin (heading) )
Y position = integral of ( measured speed * cos (heading) )
In this was we got a change in X and Y position for each test, and given this information we got an average heading from the start to the end of the test using:
Heading = inv tan ( Y position / X position )
In this case the heading error is calculated as having a standard deviation of 0.013 degrees, however this is still an over estimate, as it not only includes the effects of heading error, but also:
- any errors in speed measurement
- any errors in measured GPS absolute position at the start of the test
- any human errors in driving on the correct line at the start or the end of the test
So from this information all we can say is that standard deviation in average error in heading is less than 0.013 degrees. Since we have already established that pitch error is in the range of 0.01 degrees, and that requires the use of the less accurate up/down velocity component, in fact we should expect heading accuracy to be at least twice as accurate – so on that basis we would expect the actual standard deviation of long term average heading accuracy to be in the range of 0.005 degrees.
It is important to note that the high frequency noise in the samples will give much higher instantaneous error figures. In the worst case at 70kph there is up to 1.7 degrees of noise in the readings from thermal noise in the GPS receiver. The longer the period that it is averaged over the more the effects of this noise are reduced.
