How do I connect my own sensor, either directly, or via a DL1?
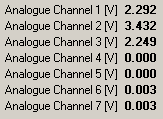
step 1: Firstly, you will need to know the voltages that the sensor attaches to specific readings. You may use the DL1 live monitor to do this. In the example shown below, analogue channel 1 is attached to an oil temperature sensor. As the temperature that the sensor is exposed to increases, the voltage output decreases. Make a note of these correlations taken at regular intervals.
step 2: Now enter the DASH2 configuration tool. It will automatically display the "Input Scaling" options when it is opened up. Under the heading "Scaling", you will find the "Generate an equation from a table" button. Press this.
step 3: You will now see a window with an xy graph and an empty table displayed on it. Use the correlations that you noted down in "step 1" to fill in the table.
step 4: As you fill in the statistics, a line will automatically be plotted on the xy graph.
step 5: Directly above this, an equation will be written. This equation will represent the distribution of your findings.
step 6: When you are happy, press "OK". You will now see that the equation is written at the top of the scaling section. The software will now recognize and be able to interpret the data that is picked up by the sensor.
step 7: Under the "Other" heading, on the right hand side of the tool, you will find a space which allows you to enter an appropriate name for the analogue channel.
step 8: Enter the "Setup screens" tab and make sure that that the sensors' analogue channel will be displayed on the DASH2 screen. (See the relevant section for information on how to do this).
When you are happy with the configuration, transfer it it to the DASH2 unit. After a few seconds, you will see the sensor readings displayed on screen.


