Dynamic Line Control
Dynamic line is a versatile data display control that consists of two points and a line which is drawn dynamically between those points.
The properties of those two points and the line can be configured to display data in different ways:
For example it can be used as:
- a stick pen to indicate the amount of g-force exerted in a g-force plot
- a needle for an analogue gauge
- a bar graph etc.
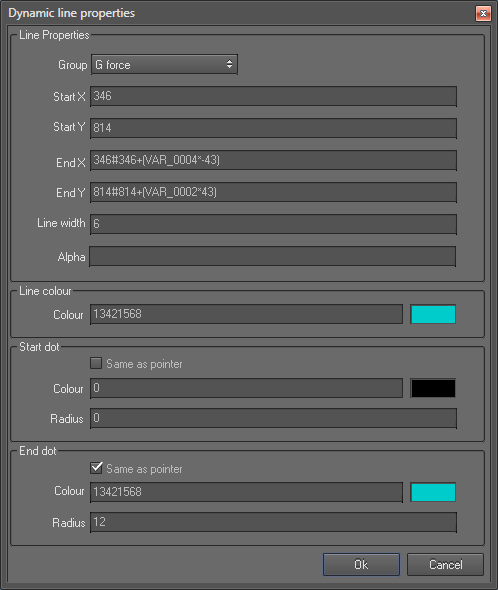
Dynamic line properties
Note: During the run time the line can grow outside of its control box area. This behaviour is different to other controls, because other controls’ activity is limited only to their control box. So it is necessary to calculate the maximum and minimum values for X and Y coordinates for a point to ensure two things:
- To avoid the line from growing outside of the area that you want it to be
- To avoid the line from going out of the screen area if the coordinates of a point exceeds the maximum x and y values or goes below zero
Line Properties section
- Start X and Start Y refers to the coordinates of start position (start point)
- End X and End Y refers to the coordinates of End position (end point)
- Line width refers to the width of the line drawn between two points
- Alpha: This specifies the transparency of the line. Values may range form 255 (opaque) to 0 (invisible)
Line colour section
- Colour refers to the colour of the line
Start dot section
Properties in this section allows you to control the appearance of the circular dot at the start position of the line:
- Same as pointer: uses the line colour as the dot colour and ignores the colour setting described below.
- Colour refers to the colour of the start dot.
- Radius: radius of the start dot in pixels.
End dot section
Properties in this section allows you to control the appearance of the circular dot at the end position of the line:
- Same as pointer: uses the line colour as the dot colour and ignores the colour setting described below.
- Colour refers to the colour of the end dot.
- Radius: radius of the end dot in pixels.