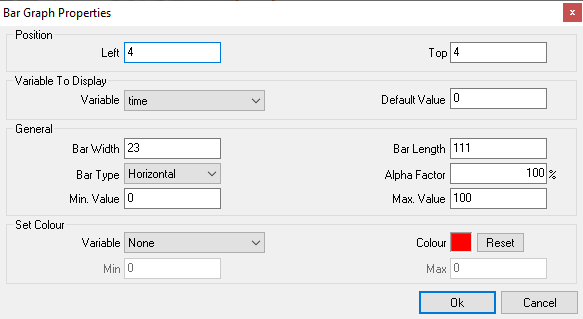
Bar graph properties
The form contains the following:
Position related properties
- Left (textbox) – These are the coordinates of the left border of the control
- Top (textbox) – These are the coordinates of the top border of the control (read only)
Variable properties
- Variable (combo box) – This allows you to select the input variable. At run time the current value of the variable will be displayed in the form of a bar graph inside this control. This property can be changed by dragging and dropping the appropriate variable from the variables pane in to the body of the control in the design area.
- Default value (textbox) – This is a default value assigned to the variable at start-up (when the overlay file is loaded). This will be used to generate the sample that is displayed on the design area.
General properties
- Bar width (textbox) – This is the width of the bar graph. When using a horizontal graph, this specifies the width of the graph in the vertical direction (y-axis). When using a vertical graph, this specifies the width of the graph in the horizontal direction (x-axis). It should be noted that the size of the bar graph can be altered by resizing the control on the design area.
- Bar type (combo box) – There are two types of bar graph;
- Horizontal – Here, as the variable value increases, so too does the length of the bar in the horizontal direction (x-axis).
- Vertical – Here, as the input variable increases, so too does the length of the bar in the vertical direction (y-axis).
- Alpha factor (textbox) – This specifies the transparency of the bar graph control in the final video. Values may range form 100 (opaque) to 0 (invisible)
- Min and Max values - For Min and Max, you can assign two values from the range of values which input varible can have.
*If Min value is less than the Max value, length of the indicator bar increases from left to right.
*If Min value is greater than the Max value, length of the indicater bar increases from right to left.
Colour Properties
- Variable (combo box) – the foreground colour of the bar graph can be based on variable. By selecting a variable the colour property is disregarded. Based on the value of the variable, colour of the bar will change from blue to red as indicated by the below image.
- Colour – This allows you to select the colour of the bar graph
- Min (textbox) – for values of the variable that are less than the min value the colour of the bar graph will be blue
- Max (textbox) – for values of the variable that are greater than the max value the colour of the bar graph will be red