User Interface Introduction
The Live monitor user interface consists of following sections:
- Menu Bar
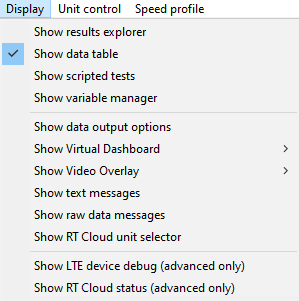
- Split panes which can be show/hide as necessary (Data table, Results Explorer, Scripted tests, Variable manager)
- Data display windows (Virtual dashboard, Speed profile, Text messages, Raw messages, RT Cloud status)
- Configuration windows (Data output options , Script editor...)
- Status bar
Menu Bar
The Menu bar contains commands to following functions:
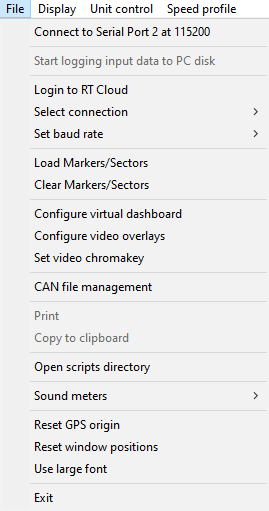
| File
|
|
- Connect/Disconnect to <Port number> at <speed >
- Start/Stop logging input data to PC disk
- Login to/Logout of RT Cloud
- Select connection (Serial, USB, Bluetooth, RT Cloud)
- Set baud rate (115200, 460800, 921600)
- Load Markers/Sectors
- Clear Markers/Sectors
These commands applies to Track map controls displayed in Virtual dashboard and video overlays. By default,track map controls display lap and sector markers defined in the track database.
Use "Load markers/sectors" command to load markers/sectors from a lap file. The default markers from the track database will not be displayed/available when using a lap file.
"Clear markers/sectors" command clears markers/sectors loaded using a lap file and start displaying the markers/sectors from the track database again.
- CAN file management - Opens the Var and CAN Manager application
- Print – send the contents in the clipboard to the default printer
- Copy to clipboard – copies the content in the program memory buffer into the windows clipboard. (Using the “Copy to print” context menu command in the Result explorer, you can copy one or more data nodes one after another into the program memory buffer. The buffered data can be copied to Windows clipboard by using “Copy to Clipboard” command.
- Sound meters
This will reset the communications to the sound meters and the maximum sound level. If this still doesn't work, it might be required to remove and plug the sound meters USB into the PC, or even plug the sound meter into a different USB port to force the PC to reset the communications.
- Reset GPS origin
- Reset window positions
- Use large font - enables large font option in the Data table
Exits from the application
|
|
|
| Display
|
|
|
|
|
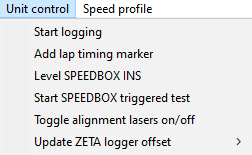
| Unit control
|
|
- Start logging
This can be used to remotely start logging on the connected device
- Add lap timing marker
This can be used to remotely add lap timing marker on the connected device
- Level SPEEDBOX INS
For more information click here
- Start SPEEDBOX triggered test
This remotely starts a triggered test on the connected SPEEDBOX
- Update ZETA logger offset
For information on the operation of the ZETA commands, please contact your ZETA logger reseller
|
|
|
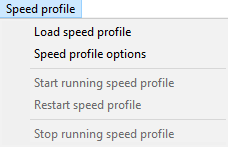
| Speed profile
|
|
- Load speed profile
- Speed profile options
- Start running speed profile
- Restart speed profile
- Stop running speed profile
|
Split Panes
You can show or hide following split windows using the “Display” menu.
Changing the width of a pane
To change the width of a pane:
- Move the mouse cursor over the vertical border of a pane, resizing cursor will appear
- Then click and drag the border to increase or reduce pane width
Status Bar
Status bar is the bottom partition of Live Monitor and it displays the following information.
| Unit Serial No: Connected hardware device’s serial no
| 
|
| Firmware version
| 
|
| Logging status – On or off
| 
|
| Streaming to disk: On or Off
| 
|
| OK: number of valid data packets received
| 
|
| Errors: number of invalid packets
| 
|
| GPS Date and Time
| 
|
| GMT offset
| 
|
Note: Clicking on the status bar opens the “Text Messages” window.
