How do I get started on the analysis software?
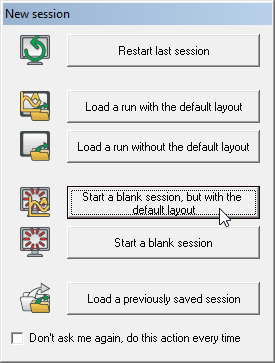
When you enter the analysis software, you will be given an option to load the default layout. This layout will give you everything that you need to get started in analysing your run data. Click the "Start a blank session, but with the default layout" button.
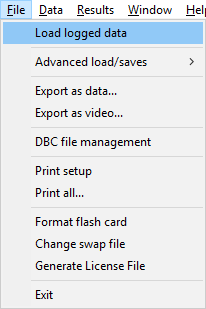
Once the default layout has been loaded, you will need to load up some data. This will probably be on a Compact Flash card. If so, make sure that your card reader is properly connected to your computer, and enter the "File" menu in the top, left hand corner of the screen. Select "Load Logged Data".
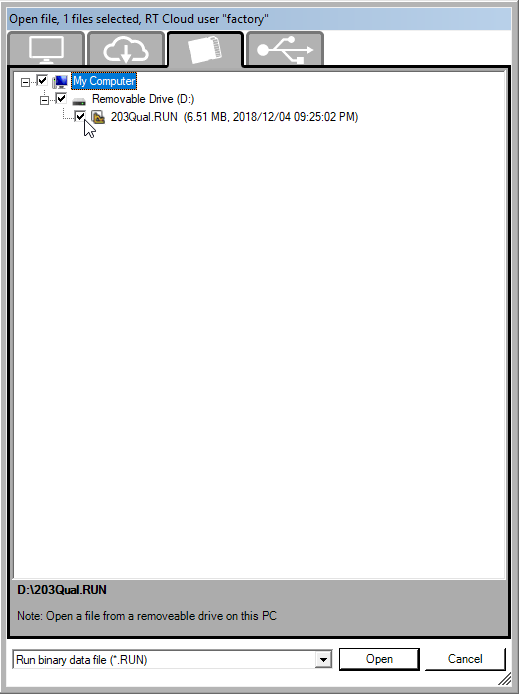
Now click on the "SD Card" tab in the pop up window and you will see the connected flash drive in the list. Now navigate to the file and select it by either double clicking the file name or by enabling the check bow to the left of the file name. Now click "Open" to load the file to the analysis software.
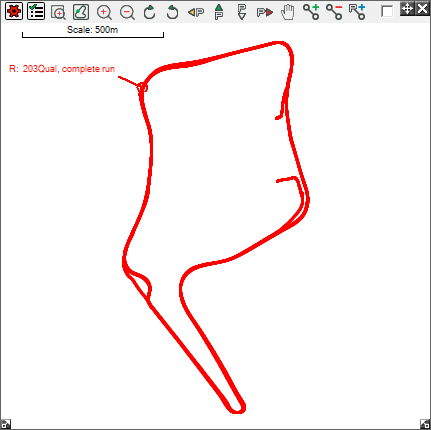
Once the data is loaded, open track map window by clicking on the  icon in the toolbar(if not already opened). This will show the track map for the loaded run file.
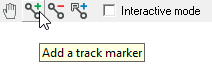
Before you can analyse your data, you will have to add a lap marker to the track. Click on the appropriate icon (shown below) in the tool bar above the track map.
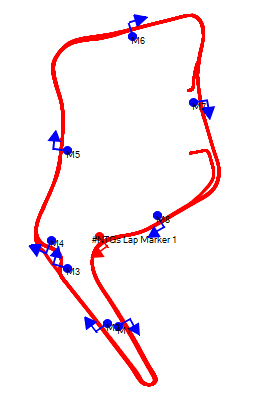
Now drag your marker over the track, in the place that you wish to act as the start line. N.B. The arrow on the marker must be pointing in the direction of travel.
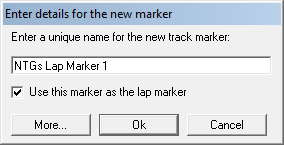
When the marker is in place, a window will appear. Name your marker and then press "OK".
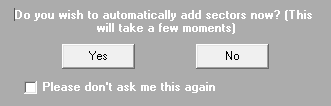
Another window will give you the option to add sectors. Press "Yes".
Lap and sector markers will now automatically be added to the track map.
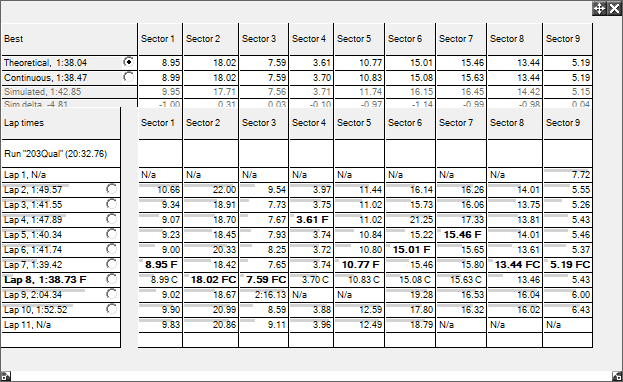
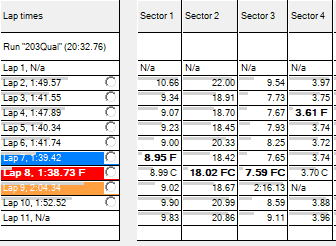
Times will also appear in the "Lap and Sector Times" table.
Click on the areas that you wish to study in detail to highlight them.
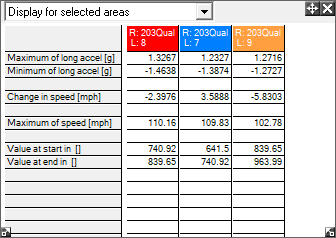
Once highlighted, the details of areas selected will appear in the "Summary Statistics" table,
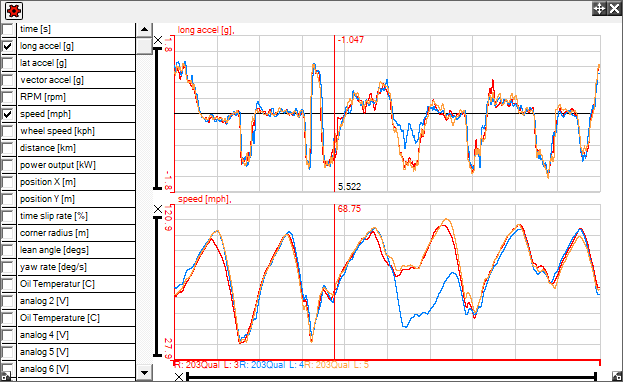
and on the "Quick Graph" at the bottom of the screen.