Variable Values Table
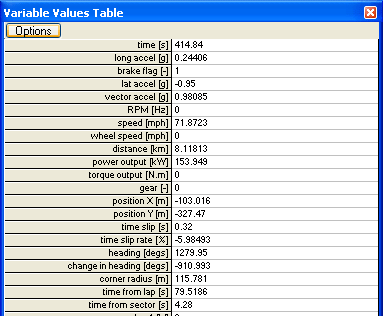
The Values table is accessible by going to > Results > Values Table, or by clicking the  button on the toolbar. The table shows the current results for the selected data, for all the variables enabled (to learn how to enable/disable variables, click here):
The way the data is represented changes on how it's selected. If you have a singular point selected on the Track Map or the XY Graph, then the data displayed will be specific to that point on the graph/map. If you have more than one trace displayed on the track map or graph, then the Values Table will display all the variable data relevant to all the points selected. the data will be colour co-ordinated with the points you have selected. For example, if you had selected three laps on the track map and clicked to select one point on all three maps, the values table would look like this:
You can also use the Values Table to display the variable data that is applicable to the ranges. When you select a range of data, i.e. a sector from the Lap And Sector Times table, or hold shift and drag a selection on the track map or XY graph, the values table will display up to three options:
- the first and last values in the selection
- the range (signified by a Δ symbol)
- the maximum and minimum values for the range (signified by the up and down limit arrows)
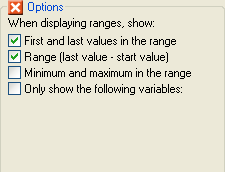
Each of the three options can be toggled on and off to your needs in the options menu:
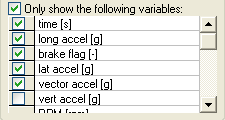
The final option allows you to select the variables that are displayed on the table. To select a variable, tick it off on the drop down menu.
When you are satisfied press "OK".

 button on the toolbar. The table shows the current results for the selected data, for all the variables enabled (to learn how to enable/disable variables,


