Analyse data
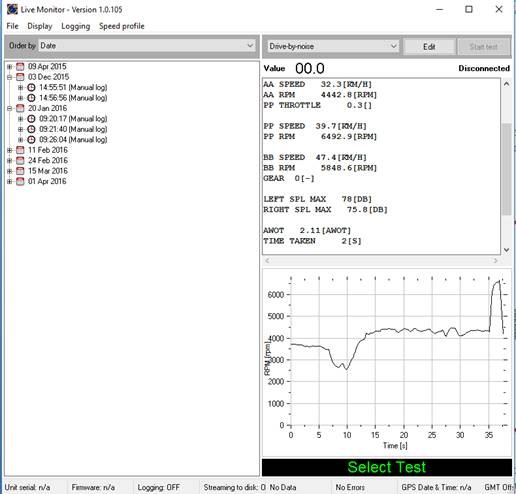
After performing a test the user can see the test data at any time by selecting a test on the Results explorer. If the user performs multiple tests all the tests are listed and he can analyse all the data one by one.
Test results
The summary results text box highlighted in green above displays the test results configured by the script using “RecordResults” keyword and other test summary details.
The graph highlighted in red above can be configured by the script. By specifying a variable and its Min, Max values in the script the graph can be set to manual scale, or else it is set to auto scale. In graph the X axis denotes time and Y axis will denote values according to the variable defined in the script (speed, break, RPM, etc.). If multiple tests are performed within the same script then the lines will overlay on the display.
By clicking on the test results window a menu will be displayed enabling printing of the data or copying to the clipboard for pasting in to other applications.
Results explorer
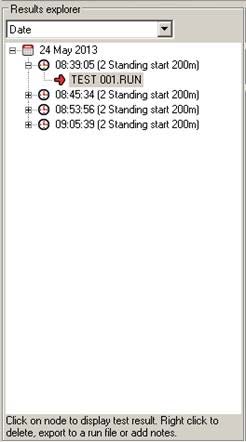
Results explorer shows the entire tests conducted by the user. It can be sorted by date, test schedule, vehicle, tester and test location. User can see the test summary results by selecting the required parent test node. The results graphs will be displayed when user selects a particular test under the parent test node. Further user can Add notes, Export to run file or Delete a test. If the test generates multiple test files all the tests are listed under the parent test node.