Bar Chart (Histogram)
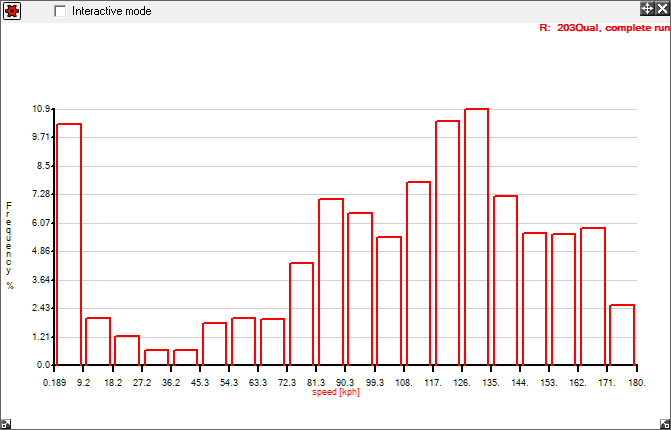
The bar chart (also known as a histogram) can be used to look at the frequency or distribution of a particular variable. For example the most common application is to look at the range of engine speeds for a particular section of the run. To access the bar chart, go to Results > Bar Chart or click the  button on the tool bar.
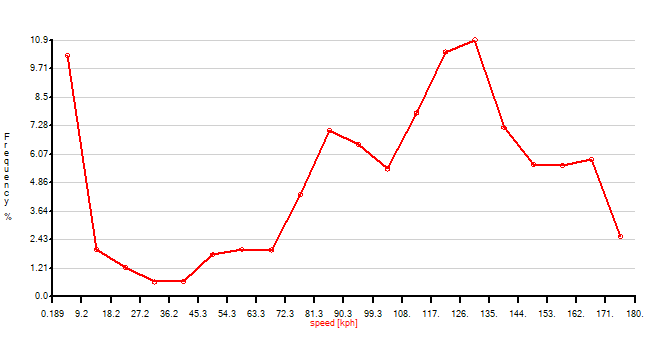
The options are as follows: (click on  to go to options)
- Show Grid adds a grey horizontal line at each division on the Y-axis, to allow for easy approximations of the height of the results.
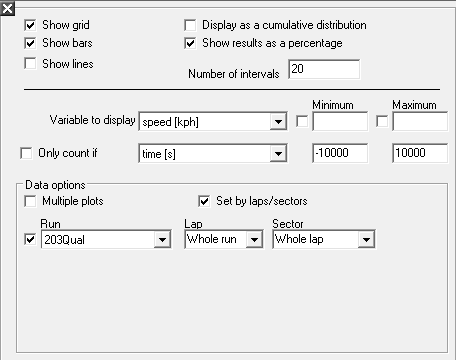
- At least one of Show Bars and Show Lines must be toggled, otherwise you wouldn't be displaying a graph at all. Show Bars displays a bar for each bin:
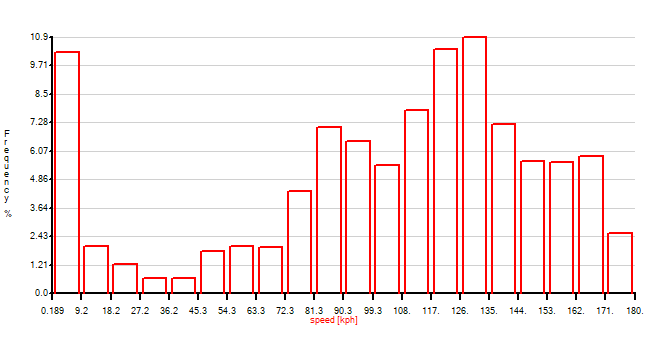
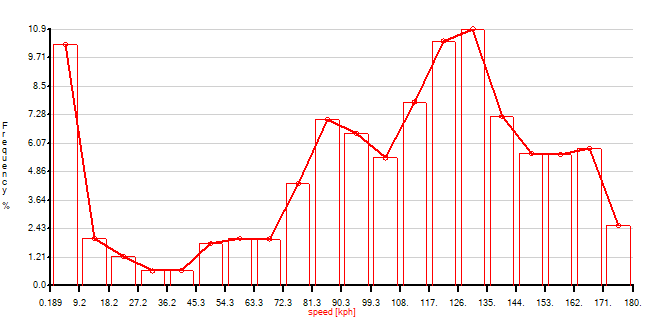
Show Lines draws a line from the top point of each bar to the next, connecting them one by one:
When only bars or lines are showing, they will be in bold, but when both are showing, the bars will be thin, but the lines will be bolded:
- Display as cumulative distribution allows you to set whether to view the data as a simple distribution where the highest point indicates the mode of the distribution, or cumulative where the frequencies are totalled up across the graph.
- Number of intervals simply sets the number of bins that the data is sorted into.
- The Variable To Display is simply the variable that you wish to plot the distribution of, you also can set an upper and lower limits on this variable if you wish to view only part of the distribution. For example, you can set the upper and lower revolution limits you wish you look at.
- The “Only Count If” option allows you to ignore data that is not of interest. For example when looking at a distribution of RPM you may chose to exclude data where you where travelling below a certain speed, or even below an acceleration threshold.
- The Data options section is the same as it is for the XY graph and the TrackMap view, you can either view the data from a particular lap/sector or for a particular time segment of a run.