Graph control
This control is used to display a line graph to show how the value of a variable changes over time.
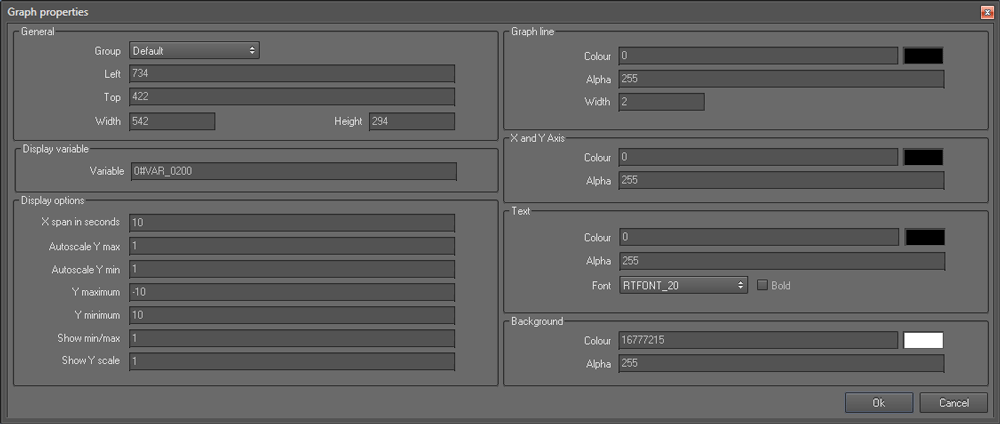
Properties
General section
- Left and Top refers to the coordinates of the left and top border of the control.
- Width and Height refers to the display width and height of the map.
Display variable section
- Variable allows you to specify a input data source for the control. It could be a variable or an equation.
Display options section
- X span in seconds
- Autoscale Y max
- Autoscale Y min
- Y maximum
- Y minimum
- Show min/max
- Show Y scale
Graph line section
- Colour refers to the colour of the graph line
- Alpha refers to the transparency of the graph line colour. Values may range form 255 (opaque) to 0 (invisible).
- Width refers to the width of the graph line.
X and Y Axis section
- Colour refers to the colour of the X and Y axes.
- Alpha refers to the transparency of the X and Y axes. Values may range form 255 (opaque) to 0 (invisible).
Text section
- Colour refers to the colour of the font
- Alpha refers to the transparency of the text displayed. Values may range form 255 (opaque) to 0 (invisible)
- Font allows you to change the font size
- Bold: Select this option if you need to show the text in bold face
Background section
- Colour refers to the background colour of the graph
- Alpha refers to the transparency of the graph background. Values may range form 255 (opaque) to 0 (invisible).