Configuring a custom equation for an input for the RT LIVE v2
1. Connect the RTLive unit to the PC with the Race Technology software package installed.
2. Open the Race Technology software launcher and proceed to open the RTLive configuration tool.
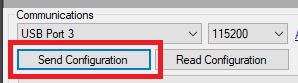
3. Set up the communications port and baud rate. The port numbers may be different for your PC, below is just an example. If you are using a serial to USB to adapter then this will show up as a USB port. The standard baud rate is 115200.
4. Press ‘Read Configuration’ to read back the current settings on the unit.
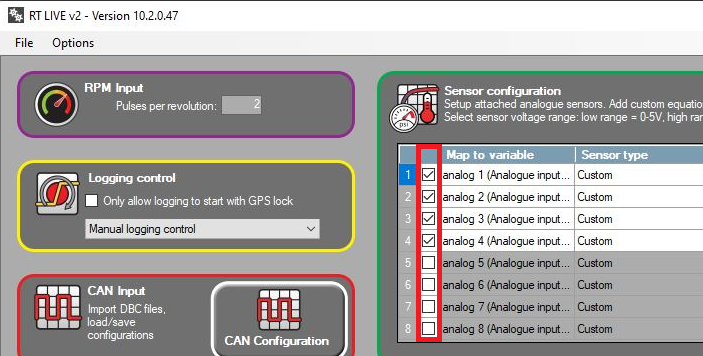
5. To configure the analogue input you must first enable the input which you wish to use (if not enabled already). This is controlled using the tickbox column. The physical inputs 1-8 on the unit correspond to the 8 rows of settings in the sensor configuration section, where input 1 is row 1, input 2 is row 2 etc.
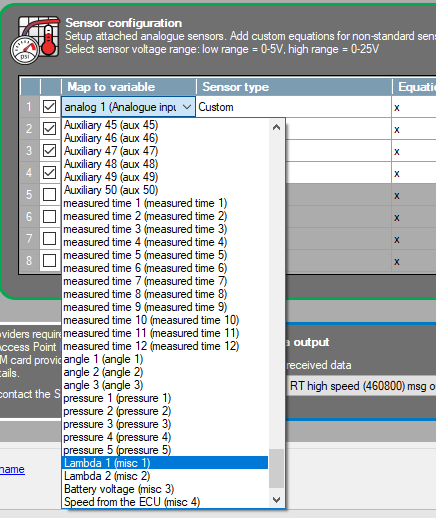
6. Next you need to map the input to a desired variable; this is done under the Map to variable column. It is up to the user which variable they wish to use. In this example ‘lambda 1 (misc 1)’ was selected. Note that the bracketed ‘misc 1’ is the native name of the variable, this is important when cross-referencing variables between multiple devices (e.g. a display unit) and also in the RTCloud, where the native names are used for reference rather than the custom name (in this case ‘lambda 1’)
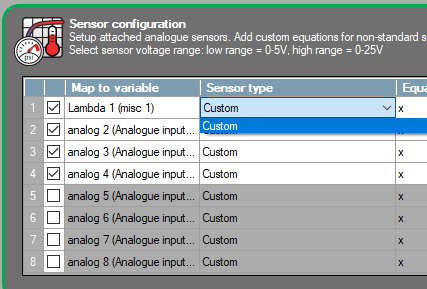
7. Next select the sensor type under Sensor type column to custom. In this case this is the only option, however for some variables there are default equations available.
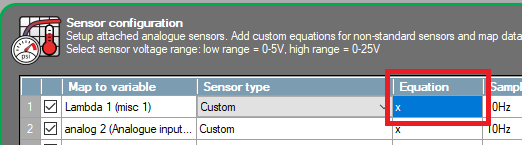
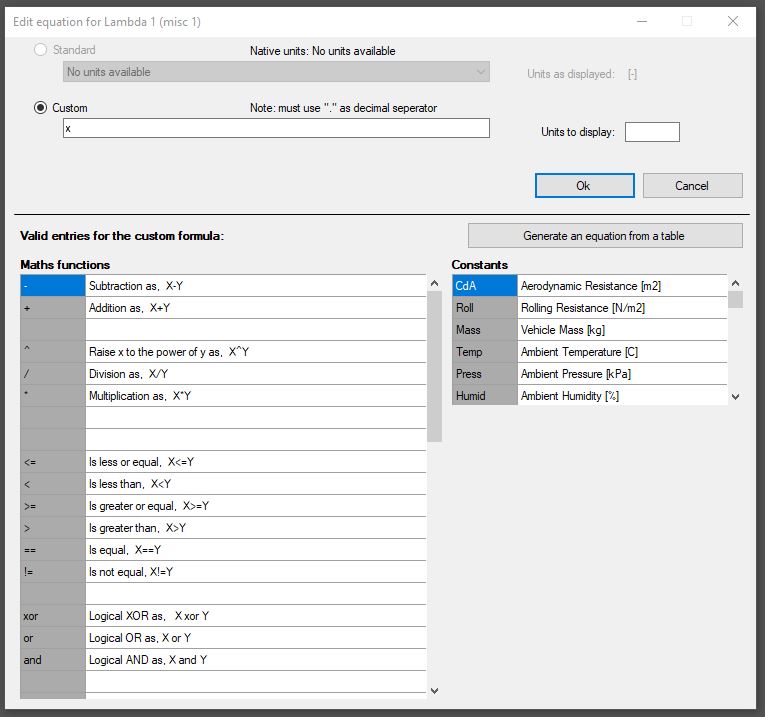
8. Select the ‘x’ under the Equation column to edit the equation. This will open another window.
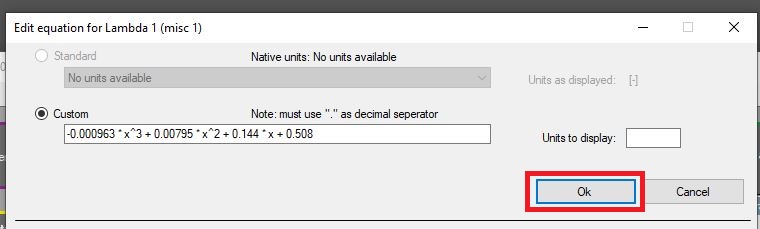
9. This window allows you to customise the mathematical function used for this variable. If you already have the equation simply enter it in the equation box and press OK, then go to the 13th step of this guide.
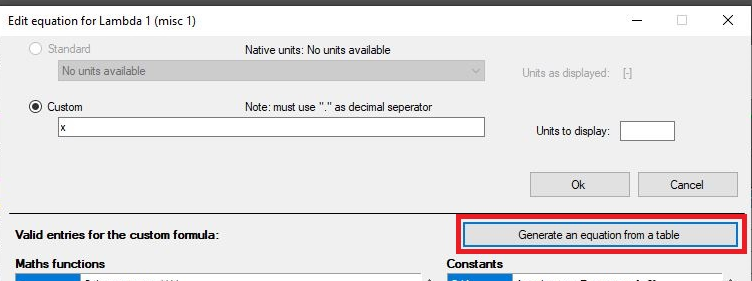
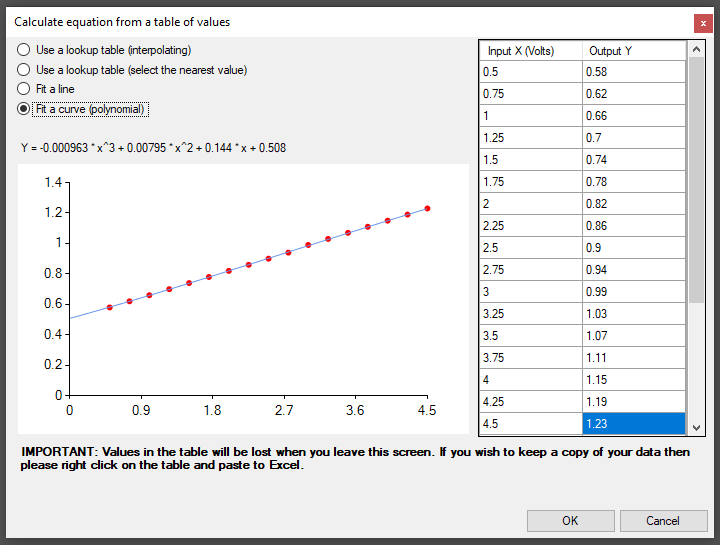
10. If you do not have the equation and wish to create one then press the ‘generate an equation from a table’ to open another window. This will allow you to create an equation using the sensor voltage-output relationship by plotting a graph and creating a line of best fit for the data.
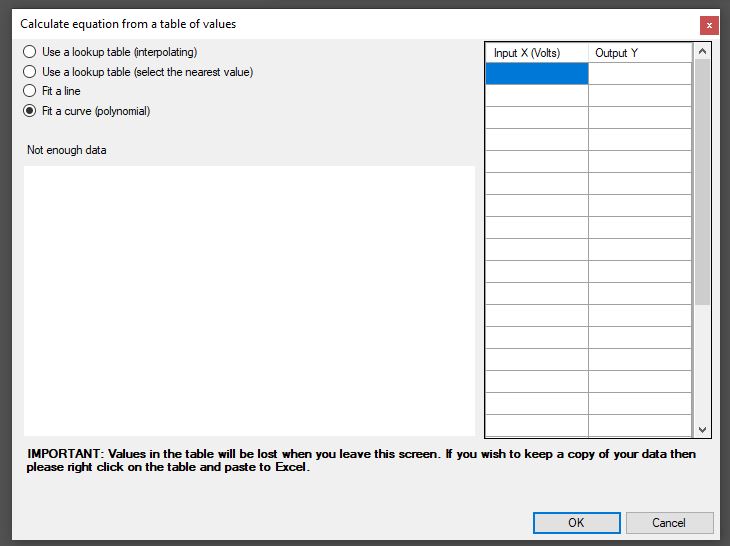
11. You will now need to populate the columns for the input and the output of the sensor. This information can usually be obtained from the manufacturer in the form of a table.
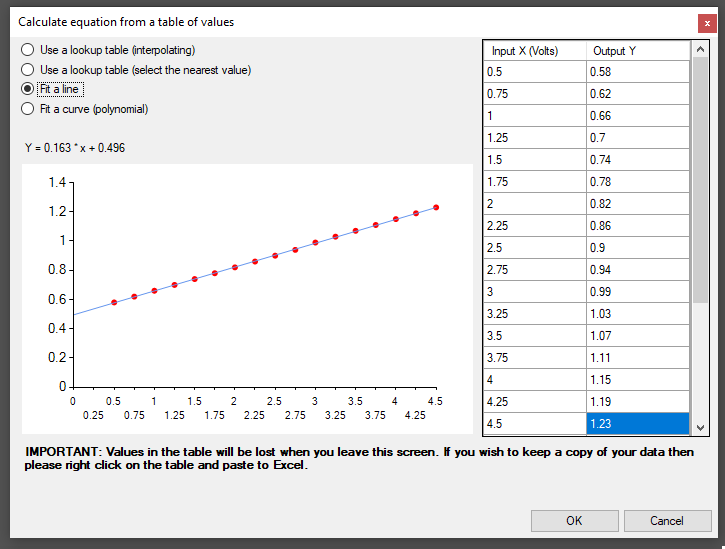
There also 4 options for a line of best fit. The selection depends on the sensor type. We have opted to use ‘Fit a line’ as the data for sensor’s specified range is virtually completely linear.
You could also use the polynomial option here; however this is usually used when the curvature is more prominent or where the linear line is unsuitable to use. As you can see the difference is nearly impossible to see.
12. Press OK and OK again to return back to the software with the new equation.
13. Send the configuration to the unit with the new settings to finish.